
End2End Solutions
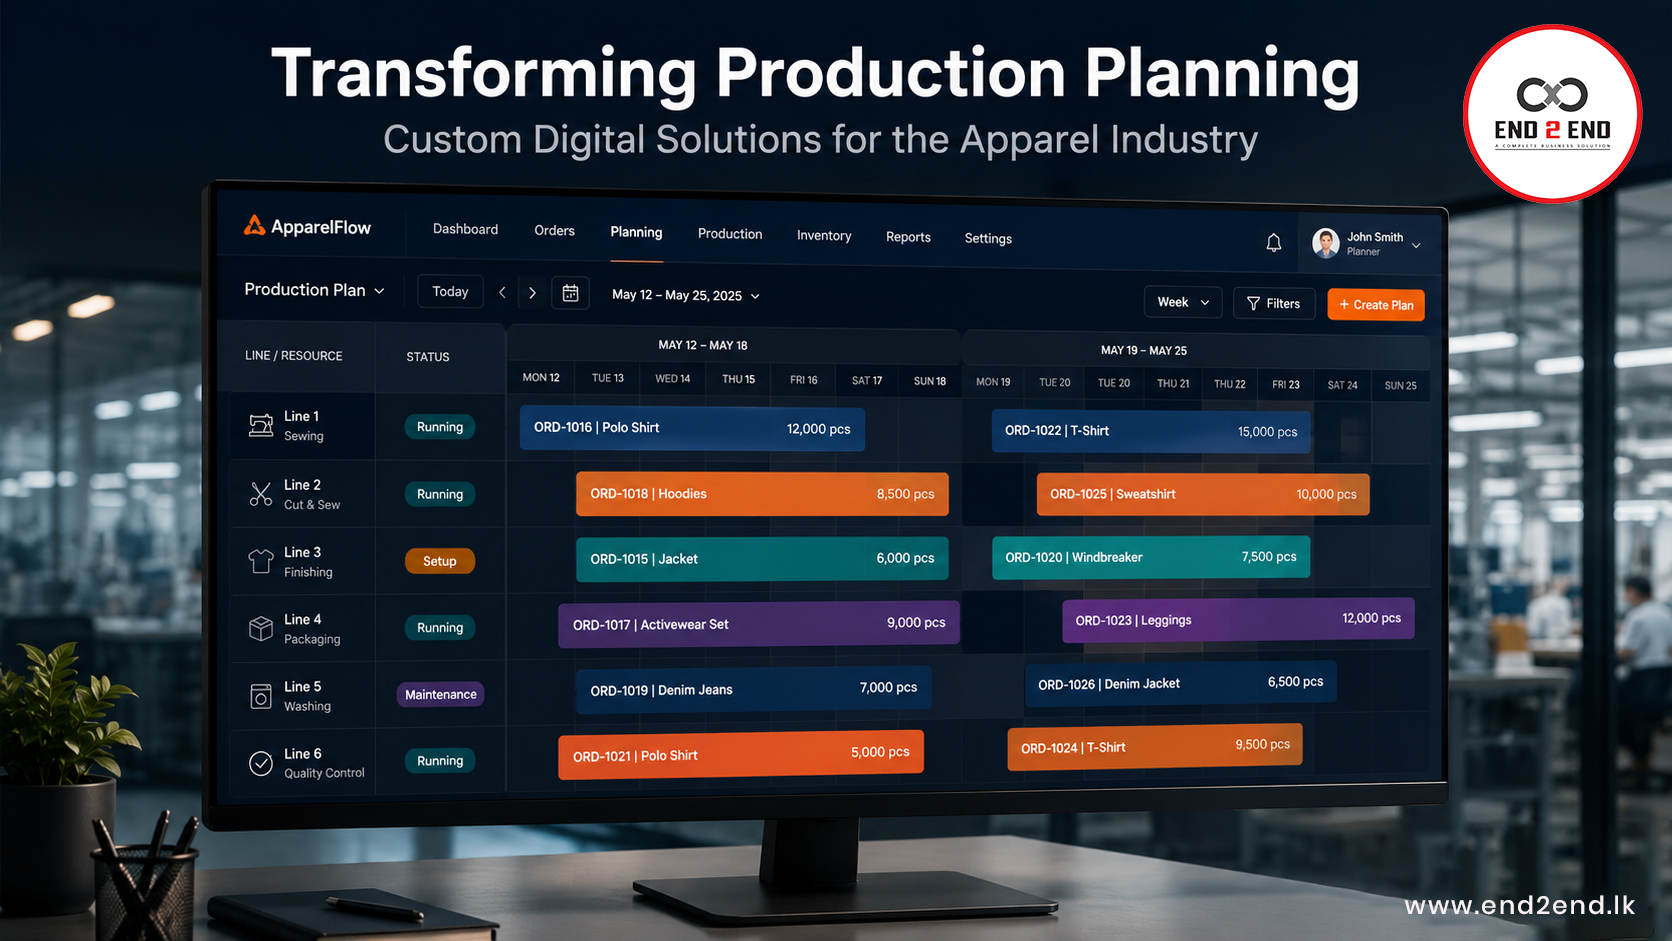
How We Built a Smart Production Planning Tool for a Leading Apparel Manufacturer
From manual spreadsheets to a fully digital, drag-and-drop production board — here is the story of how we helped a busy garment factory reclaim hours every day and make smarter planning decisions.
Every factory has a plan. The question is whether that plan is working for the team — or against it.
When one of our clients in the apparel manufacturing industry reached out to us, their planning team was spending hours each day doing things that should take minutes: recalculating dates after every schedule change, cross-referencing delivery deadlines across spreadsheets, and trying to communicate updates to managers without a reliable way to keep everyone on the same page.
We spent time with their team, understood their workflows in depth, and built them a Production Planning Board — a purpose-built digital tool that has fundamentally changed how they plan. This is the story of what we built and why.
The Problem: A Familiar Story: Great People, Painful Tools
Our client operates multiple production lines and manages hundreds of active styles at any given time. Each style has its own planned quantity, target daily output, efficiency level, delivery date, and target cut date. Keeping all of this in sync is genuinely complex work.
Their planning team was doing it entirely in Excel. And while they were very good at it, the tool was fighting them every step of the way:
Our Approach : Building Around Real Workflows, Not Generic Features
Before writing a single line of code, we sat with the planning team. We watched how they worked. We asked what felt slow, what felt risky, and what they wished they could do but couldn't.
What came out of those conversations shaped everything we built. A few principles guided the entire project:
With those principles in place, we designed and built a suite of four interconnected tools, all sharing a common data repository hosted on GitHub.
WHAT WE BUILT
The Production Planning Board Suite
The solution is made up of four tools, each serving a different role in the planning workflow:
Every tool shares the same data. When the planner saves a change, the viewer updates automatically. When the IE team uploads new OB data, the calculator picks it up immediately. Nothing is duplicated. Nothing is emailed. Everything is in sync.
The Visual Planning Board
The core of the tool is a horizontal timeline board — lines run vertically, dates run horizontally, and every style appears as a color-coded block at its scheduled position. Each block shows the style name, garment type, quantity, daily target, efficiency, TH value, delivery date, and target cut date. Everything a planner needs to assess a style is on the block itself.
The board can be zoomed from 50% to 150% — zoom out to see the full month at a glance, zoom in for detailed block inspection. It supports horizontal scrolling across any date range and updates in real time as changes are made.
Drag and Drop Editing with Auto-Shift
This is where the tool pays back most of its value, most quickly. Planners can drag any block to a new line or date. They can resize blocks by dragging the right edge. They can double-click to edit any attribute. Every action is tracked in a full undo/redo history.
The key feature is Auto-Shift mode. When enabled, moving any block automatically cascades date changes to all affected blocks on the impacted lines. Remove a block from Line 3 and all subsequent styles on Line 3 slide left to fill the gap — instantly, with no manual recalculation. Drop a block onto Line 5 and all blocks on that line shift right to make room.
What used to take 30 minutes of manual spreadsheet updates now happens in seconds — automatically, accurately, every time.
Auto-Shift respects working days (Monday to Saturday, no Sundays), preserves the planned duration of every block, and handles complex multi-line moves correctly — filling gaps on source lines and making room on target lines simultaneously. Date Validation and Smart Warnings
Every style has two critical date boundaries: the Target Cut Date (the earliest it can start) and the Delivery Date (the latest it can end). The tool validates every change against these boundaries. If a move would push any style past its delivery date or before its target cut date, a warning modal appears immediately — listing every affected style with the specific conflict. The planner can review the situation and choose to proceed or cancel. Styles currently in violation display a persistent color-coded warning badge on their block, which disappears automatically once the conflict is resolved.
This means date conflicts are caught the moment they are created — not discovered hours later when the plan has already been shared.
Style Similarity Grouping
One of the most talked-about features. Using the Operation Bulletin data, the tool compares the operations of every style against every other style. Styles sharing 90% or more of their operations are assigned the same color on the board.
The result is a planning board that visually clusters similar work together. A planner can look at the board and immediately see which styles can run consecutively with minimal changeover effort — something that was never quantified before.
Every block also shows a consecutive similarity label — for example "84% sim to PreviousStyle" — giving the planner a live, quantitative sense of line continuity without any extra clicks.
Line Similarity Analysis
When deciding where to place an incoming style, the planner can click any block to activate Line Similarity mode. The board immediately shows how similar that style is to every block across all production lines — blocks above the similarity threshold stay fully visible with percentage badges, dissimilar blocks are dimmed.
Instead of guessing which line is the best fit based on garment type alone, the planner gets a quantitative answer in one click.
GitHub Integration
The plan is saved to GitHub as an Excel file. One click from the editor — the plan is committed with a timestamp. Because it lives in a shared repository, every tool in the suite always reads the latest version. The commit history provides a complete audit trail of who saved what and when.
Management Viewer
The Planning Board Viewer is a dedicated read-only application for management. It opens with a polished loading screen, fetches the latest plan from GitHub automatically, and displays it with the full visual feature set — similarity colors, labels, delivery date view, zoom, and view options.
It auto-refreshes every five minutes. Managers are always looking at current data. No emails. No file requests. No version confusion.
BEYOND PLANNING
Turning the Plan into Manpower Numbers
The Finishing Manpower Calculator extends the tool into workforce planning. The planner selects a date range and the tool identifies all active styles, calculates daily output targets, and uses OB data to determine the daily worker requirements broken down by type — sewing operators, support staff, and quality control.
Results appear in two views: a detailed table with daily figures by line and worker type, and a visual dashboard with KPI cards and four interactive charts showing manpower trends, SMV mix, line utilization, and cadre versus demand. The dashboard can be exported as an image for sharing in reports or presentations.
UNDER THE HOOD
Simple by Design
The entire suite runs as standalone HTML files — no server, no database, no installation required. Open the file in a browser and it works. This was a deliberate choice: the tool needed to be easy to deploy, easy to share, and resistant to infrastructure complexity.
We used React 18 for the interface, SheetJS for Excel processing, Chart.js for dashboard charts, and the GitHub Contents API for file storage. The result is a tool that any team member can run on any laptop or desktop with a modern browser — with GitHub providing the shared storage and version history.
THE RESULTS
What Changed
The impact showed up quickly and across multiple dimensions:
💡 CLOSING THOUGHTS :
That is always our goal at End2End Solutions. We do not build generic software and ask clients to adapt to it. We build around real workflows, real constraints, and real people — and the result is tools that teams actually want to use.
If your team is managing production planning, scheduling, or operational workflows with tools that are not keeping up with the complexity of your work, we would love to have a conversation.
📩 Contact us : www.end2end.lk | info@end2end.lk
Good Tools Follow the Work
The best thing we can say about this project is that the tool feels natural to the people using it. Every feature maps to something they already do — it just does it faster, more accurately, and with better information.That is always our goal at End2End Solutions. We do not build generic software and ask clients to adapt to it. We build around real workflows, real constraints, and real people — and the result is tools that teams actually want to use.
If your team is managing production planning, scheduling, or operational workflows with tools that are not keeping up with the complexity of your work, we would love to have a conversation.
📩 Contact us : www.end2end.lk | info@end2end.lk